 gpu
WebGPU vs WebGL: real numbers
"WebGPU is faster than WebGL" gets repeated a lot, usually without numbers. So I wrote a small benchmark that draws the same scene both ways, ran it, and wrote down what came out. Some of it matched the folklore. Some of it did not: on my machine, thousands of separate WebGPU draw calls cost more JavaScript time than WebGL2, and at 50,000 draws WebGPU was the one that dropped frames.
What this compares, and what it does not
The games on this site, including City Drive, are WebGPU only. There is no WebGL version of any of them, so comparing them would mean comparing against something imaginary. Instead, this is a micro-benchmark of one thing that both APIs do and that people argue about: issuing lots of small draw calls, each with its own data.
That is the classic "draw call overhead" question. It is not a test of shader speed, fill rate or memory bandwidth. The GPU work here is deliberately tiny, so any difference comes from the cost of telling the GPU what to do.
You can run the benchmark yourself. It runs right here on the site with no install, and it also exposes its results on window.benchmarkResults.
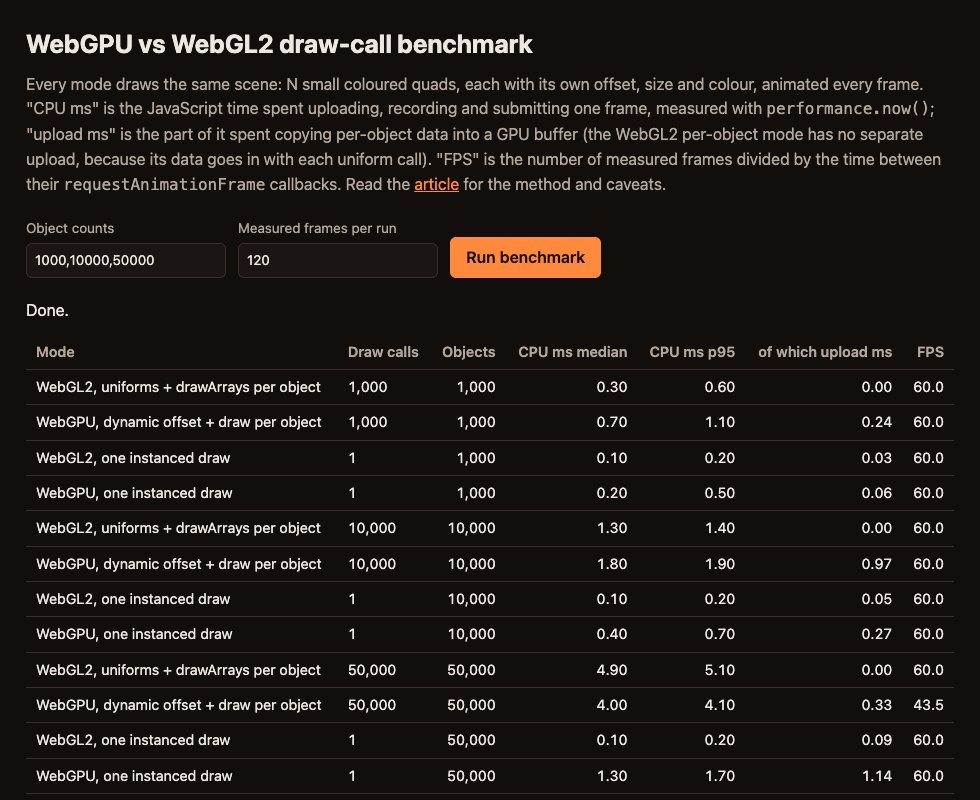
The benchmark
Every mode draws N small coloured quads at random positions on a 512 × 512 canvas. Each quad has eight floats of its own: an offset, a size and a colour. Every frame, JavaScript moves every quad slightly, so the per-object data really does change each frame. There are four modes:
| Mode | Per frame | Draw calls |
|---|---|---|
| WebGL2, per object | One uniform4fv and one drawArrays per quad | N |
| WebGPU, per object | One writeBuffer, then one setBindGroup with a dynamic offset and one draw per quad | N |
| WebGL2, instanced | One bufferSubData and one drawArraysInstanced | 1 |
| WebGPU, instanced | One writeBuffer to a storage buffer and one draw with N instances | 1 |
The per-object loops are the heart of it. In WebGL2, each quad's eight floats go straight into a uniform vec4 objectData[2] array:
function drawEachObject() {
  const { objects, objectCount } = scene;
  for (let index = 0; index < objectCount; index++) {
    gl.uniform4fv(objectDataLocation, objects, index * FLOATS_PER_OBJECT, FLOATS_PER_OBJECT);
    gl.drawArrays(gl.TRIANGLES, 0, VERTICES_PER_QUAD);
  }
}
WebGPU has no per-draw uniform call: a queue.writeBuffer takes effect before the whole submitted pass, not between two draws. The idiomatic equivalent is to upload all objects into one uniform buffer before the pass, then point the bind group at a different slice for each draw with a dynamic offset. Uniform buffer offsets must be multiples of 256 bytes (minUniformBufferOffsetAlignment on this adapter), so each 32-byte object gets a 256-byte slot.
function recordDraws(pass) {
  pass.setPipeline(pipeline);
  pass.setVertexBuffer(0, cornerBuffer);
  if (isInstanced) {
    pass.setBindGroup(0, bindGroup);
    pass.draw(VERTICES_PER_QUAD, scene.objectCount);
    return;
  }
  for (let index = 0; index < scene.objectCount; index++) {
    pass.setBindGroup(0, bindGroup, dynamicOffsets, index, 1);
    pass.draw(VERTICES_PER_QUAD);
  }
}
The loop uses the setBindGroup overload that takes a Uint32Array plus a start and length, so it does not allocate a new offsets array for each of the 50,000 calls. The WebGL2 loop is just as lean: uniform4fv with a source offset reads straight from the shared Float32Array.
The instanced modes are there as a control. They draw the identical picture with one call, so they show what the same workload costs when draw calls are taken out of the equation.
Machine and method
Everything below was measured on one machine, read from the browser itself where possible:
| Item | Value |
|---|---|
| Computer | Apple M1 Pro, 16 GB, macOS 27.0.1 |
| Browser | Chrome 157.0.8103.38, headless (--headless=new --enable-unsafe-webgpu) |
adapter.info | vendor "apple", architecture "metal-3" (device and description empty) |
| WebGL renderer | ANGLE (Apple, ANGLE Metal Renderer: Apple M1 Pro, Unspecified Version) |
navigator.userAgent | Mozilla/5.0 (Macintosh; Intel Mac OS X 10_15_7) … HeadlessChrome/157.0.0.0 Safari/537.36 |
Both APIs end up on Metal: WebGL2 through ANGLE, WebGPU through Dawn. The user agent string's "Intel Mac OS X 10_15_7" is Chrome's frozen value, not the real OS.
Each mode runs on a fresh canvas, one after another, in a requestAnimationFrame loop: 20 warm-up frames, then 120 measured frames. For each frame the page records:
- JavaScript time:
performance.now()around uploading, recording and submitting the frame. Moving the quads is done before the timer starts and is identical for every mode. - Upload time: the part of that spent in
writeBufferorbufferSubData. - Frames per second: measured frames divided by the time between their animation-frame timestamps.
I ran the full set (three object counts, four modes) four times, driving Chrome over the DevTools protocol and reading window.benchmarkResults. The page is not cross-origin isolated, so Chrome reported performance.now() in 0.1 ms steps. I quote the mean of each run's 120 frames, which averages that rounding out; the benchmark page also shows medians and 95th percentiles.
Results
Ranges are the lowest and highest of the four runs. Frame rate was capped at 60 by the display loop, so "60" means "kept up", not "60 is the limit of the API".
| Objects | Mode | JavaScript ms per frame | of which upload | FPS |
|---|---|---|---|---|
| 1,000 | WebGL2, per object | 0.16–0.45 | none | 60 |
| 1,000 | WebGPU, per object | 0.40–0.91 | 0.17–0.38 | 60 |
| 1,000 | WebGL2, instanced | 0.03–0.05 | 0.01–0.02 | 60 |
| 1,000 | WebGPU, instanced | 0.14–0.36 | 0.04–0.09 | 60 |
| 10,000 | WebGL2, per object | 0.87–1.31 | none | 60 |
| 10,000 | WebGPU, per object | 1.69–1.85 | 0.87–0.96 | 60 |
| 10,000 | WebGL2, instanced | 0.07–0.09 | 0.04–0.05 | 60 |
| 10,000 | WebGPU, instanced | 0.35–0.52 | 0.23–0.37 | 60 |
| 50,000 | WebGL2, per object | 4.89–5.01 | none | 60 |
| 50,000 | WebGPU, per object | 3.96–4.11 | 0.33 | 43.0–43.3 |
| 50,000 | WebGL2, instanced | 0.08–0.12 | 0.06–0.09 | 60 |
| 50,000 | WebGPU, instanced | 0.83–1.38 | 0.78–1.30 | 60 |
Three things stand out:
- With one draw per object, WebGL2 spent less JavaScript time than WebGPU at 1,000 and 10,000 objects.
- At 50,000, WebGPU's JavaScript time was about 18% lower, yet it was the only mode that could not hold 60 fps.
- Instancing beat every per-object mode by a wide margin in both APIs, and WebGL2 instancing had the lowest JavaScript time of all.
None of that says WebGPU is slow. It says the cost of a draw call does not live where you would guess, and that performance.now() around your render function measures only the part you can see.
Why WebGPU's JavaScript time is not lower
The upload column explains a lot of it. Because of the 256-byte alignment, the WebGPU per-object mode writes 256 bytes per object: 2.56 MB a frame at 10,000 objects, for 320 KB of actual data. That writeBuffer alone took 0.87–0.96 ms, about half the frame's JavaScript time. WebGL2 has no separate upload at all; its 32 bytes per object travel inside each uniform4fv call.
Take the upload away and the per-draw cost is close. At 50,000 objects, WebGPU's remaining 3.7 ms works out at roughly 75 ns per setBindGroup plus draw, against roughly 100 ns per uniform4fv plus drawArrays in WebGL2. Those are averages of a whole frame divided by the number of objects, not a measurement of a single call.
The upload numbers are not tidy. Writing 12.8 MB at 50,000 objects took 0.33 ms in every run, less than the 2.56 MB write at 10,000. I do not have an explanation I can back up, so I am reporting it as measured rather than guessing at Chrome's internals.
WebGPU also has a fixed cost per frame that does not show up in WebGL2's JavaScript time. Each frame calls getCurrentTexture(), creates a view, a command encoder and a render pass, then finishes and submits. You can see it in the instanced rows: at 1,000 objects, with only a tiny upload, WebGPU spent 0.14–0.36 ms against WebGL2's 0.03–0.05 ms. That is small in absolute terms, but it is there in every frame.
If the dynamic-offset upload bothers you, there are other designs. A storage buffer indexed by instance_index, with each draw passing its object number as firstInstance, avoids the padding. I benchmarked the common textbook pattern, not the cleverest one.
Why 50,000 WebGPU draws ran at 43 fps
At 50,000 objects, WebGPU spent about 4 ms of JavaScript per frame, a quarter of a 60 fps budget, and still ran at 43 fps. Something other than JavaScript was the bottleneck.
In Chrome, neither API talks to the GPU from the page's thread. WebGL calls are put into a command buffer and executed by ANGLE in the separate GPU process. WebGPU calls are serialised by the page and replayed by Dawn in the GPU process, which validates them and translates them to Metal. So I recorded three-second Chrome traces while each mode was running and added up how busy the GPU process's main thread was:
| Mode | Objects | GPU process main thread busy | Page main thread busy |
|---|---|---|---|
| WebGL2, per object | 10,000 | 20.8% | 10.3% |
| WebGPU, per object | 10,000 | 32.9% | 15.4% |
| WebGL2, per object | 50,000 | 54.5% | 36.2% |
| WebGPU, per object | 50,000 | 99.6% | 29.6% |
| WebGL2, instanced | 50,000 | 7.1% | 21.8% |
| WebGPU, instanced | 50,000 | 4.7% | 21.3% |
These come from one trace per row, so treat them as indicative. The picture is still clear: at 50,000 draws, the GPU process was busy for 99.6% of the time with WebGPU, and the frame rate was capped by how fast it could get through 100,000 commands a frame. WebGL2 needed about half of that thread for the same scene. In the instanced rows, much of the page's main-thread time goes on moving 50,000 quads in JavaScript, which happens outside the timed section.
To check that the 12.8 MB upload was not the real culprit, I ran a modified copy of the page that skipped writeBuffer in the WebGPU per-object mode. It drew nothing useful, since the buffer was never filled, but in a single run it gave 3.7 ms of JavaScript, 47 fps and a GPU process still 99.8% busy. The upload costs a few frames per second; the per-draw work in the GPU process is the wall.
This is the honest version of "WebGPU has lower draw-call overhead". WebGPU moves validation out of the draw call: pipelines and bind groups are checked when you create them, so each draw has less to check than a WebGL call that must look at the whole global state. But in a browser every command still crosses a process boundary and gets checked for safety on the other side. On this machine and Chrome build, that path was more expensive per draw for WebGPU than for WebGL2.
What instancing changes
Both instanced modes drew all 50,000 quads in a single call, held 60 fps easily, and left the GPU process mostly idle. WebGPU instancing at 50,000 objects cost about a fifth of the JavaScript time of WebGL2 per-object drawing at the same count, and most of that was the upload.
That is the real lesson of this benchmark, and it applies to both APIs: the fastest draw call is the one you do not make. If thousands of objects share a mesh and a pipeline, put their data in a buffer and draw them together. City Drive draws its trees this way, with one instanced draw per species and level of detail. The instancing tutorial shows how.
Differences a frame time cannot show
If draw-call speed is not a clear win, why use WebGPU at all? Because most of its advantages are about what you can do, not how fast you can make many small calls. The WebGPU introduction covers them properly; briefly:
- Compute shaders. WebGL2 has none. You can fake general GPU work with fragment shaders and render-to-texture, but WebGPU gives you storage buffers, workgroups, atomics and dispatches directly. The GPU text search on this site would be awkward in WebGL2.
- WGSL instead of GLSL. WGSL is a new language with explicit types, explicit bindings (
@group(0) @binding(0)) and the same source on every platform, translated by the browser to Metal, HLSL or SPIR-V. GLSL ES 3.00 is older and familiar, but its uniforms are looked up by name at run time. - Explicit pipelines. In WebGL, blending, depth testing, shaders and vertex layout are global switches you flip before each draw. In WebGPU they are baked into an immutable
GPURenderPipelinecreated up front, and resources are grouped into bind groups. That is more code at start-up and less guessing for the driver while drawing. - Command buffers. WebGPU records work into command encoders and submits finished command buffers to a queue, so you decide when work is handed over. WebGL has no command buffers you can see: each call is an instruction to the context, and the browser batches them behind your back.
- Errors. WebGL reports through
gl.getError(), which you poll. WebGPU validates every call, reports through error scopes and theuncapturederrorevent, and an invalid object makes every later call that uses it fail validation too, rather than silently doing something undefined. The messages are much better.
Key takeaways
- On an M1 Pro in Chrome 157, WebGL2 used less JavaScript time than WebGPU for 1,000 and 10,000 separate draws.
- At 50,000 separate draws, WebGPU used less JavaScript time but ran at 43 fps, because Chrome's GPU process was saturated.
- Timing your render function measures only the page's share. Check the frame rate, and a trace, before drawing conclusions.
- WebGPU's 256-byte uniform offset alignment makes the dynamic-offset pattern upload eight times more data than it uses here.
- Instancing beat per-object drawing in both APIs by far more than either API beat the other.
- Choose WebGPU for compute, WGSL, explicit pipelines and better errors, not on the assumption that every draw call is cheaper.
How far to trust these numbers
Not too far. This is one machine, one browser build and one operating system, in headless mode, with the frame rate tied to a 60 Hz animation loop. A Windows PC with Direct3D underneath, a different GPU, a future Chrome build or Firefox and Safari could all change the picture, and Dawn and ANGLE both get faster over time.
The workload is also deliberately unrealistic. Real scenes change pipelines, textures and buffers between draws, which costs WebGL more state work and is where WebGPU's pre-validated pipelines and bind groups should help most. This benchmark changes almost nothing between draws, which is WebGL2's best case.
And it measures CPU-side cost only. I did not measure GPU execution time, and the GPU process numbers come from one trace per mode.
That is exactly why the benchmark is public. Run it on your machine, change the object counts in the box at the top, and you will get your own table in a minute or two. If your numbers disagree with mine, believe yours.
Official documentation
Go deeper with the specifications and reference documentation:
- developer.chrome.com
From WebGL to WebGPU
Chrome's official guide to the differences between the two APIs.
- developer.mozilla.org
MDN: WebGPU API
The full WebGPU reference.
- developer.mozilla.org
MDN: WebGL API
The full WebGL reference.
- toji.dev
WebGPU best practices
How to structure WebGPU code to get the performance benefits.